Data Visualisation or Digital Veneer – Getting beyond false data maturity dawns to become ready for AI
In his latest blog post my colleague Stuart Arthur warned how we should be wary of ‘digital veneers’ that cover up poor foundations. Controversial Opinion, but experience tells me Data visualisation can be such a veneer. While the impact of a well-designed visual dashboard to a decision maker who has been trawling through spreadsheets looking for insight is significant, they are often a false dawn in data maturity.
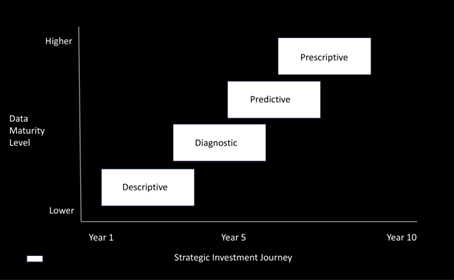
What I mean by this is, we can produce impactful descriptive and diagnostic data visualisations with data that has not been largely improved after extraction from a source database. The same is not usually true about predictive and prescriptive outputs. Such outputs are dependent on data that is significantly improved compared to what exists in many databases today.
In most organisations, databases exist at a line of business system level, they have by definition been designed to tactically support a particular line of business activity. They were not developed to prepare data for anything other than rudimentary analysis in basic reporting tools.
One very simple but hugely concerning example of this is how databases regularly overwrite data in their tables, as system function takes precedence over long term data quality. The impact over time is the organisation loses millions of data points that the uninitiated believe will have been temporally captured and as such it simply loses its understanding of precisely when things happened, how long they took etc., These shortcomings are often hidden in the way analysts prepare their visualisations, but this level of temporal data capture is essential to predicting demand and prescribing actions in response.
So, while we can build visual, interactive analysis with data largely as is from our data bases and other sources, those of us that want to enable great opportunity from AI are approaching the way we work with data differently from the outset.
While the impact of a well-designed visual dashboard to a decision maker who has been trawling through spreadsheets looking for insight is significant, they are often a false dawn in data maturity.
Foundations that continuously improve the quantity and quality of data required to deliver results with AI.
Preparing for AI
By deploying the right data platform architecture and functional operating model, we bring our disparate data together and ensure we capture every key data point through appropriate change data capture routines. To the organisation wanting to achieve great things with AI, shifting to enterprise change data capture is not about running low cost pipelines (although this is definitely a benefit over overwriting warehousing). It is all about capturing the precise data points in their millions to enable the quantity of quality data required to accurately use predictive models and cognitive services.
For organisations not working with big data, but are asking the question what do we need to do to prepare for AI, the requirement to ensure all data points are captured is even greater, as the volumes of data are lacking as it is. The more complex the organisation the more likely they are not working with big data in many parts of their core operations. The greater then the need to ensure the data they do have is captured as it needs to be, not as it is stored in tactical databases.
Predictive and Prescriptive analytics are today very much part of the current AI multiverse as they draw on Machine Learning, Large Language Models, Cognitive Services etc., However, forward thinking data leaders have long been promoting a scaling foundational approach to working with data, to enable these Predictive and Prescriptive outputs in the future. Foundations that continuously improve the quantity and quality of data required to deliver results with AI.
Bringing data together for success
This familiar diagram above shows a typical journey for many complex organisations to deploy and realise the benefits from increasingly sophisticated data analysis. However what often gets missed is understanding the sequential achievement along the timeline is entirely dependent on the organisations ability to bring its data together and improve it consistently over time. This means overcoming a landscape of disparate data, of differing quality, distributed in silos around the organisation from the beginning of building your new descriptive analytics all the way through to sweating AI.
In short, if you are serious about harnessing AI beware of the digital veneer of tactical data visualisation. Be very aware of the poor quality of data in your databases by their very design. In response, get your data into an strategic architecture and manage it to improve its quantity and quality. It’s a win-win as the quality of your descriptive and diagnostic reports will increase dramatically as a result and everything will become way more affordable.
Don’t be put off by time, building great data quality aligned to purpose, takes real effort but it also takes the right investment. To coin a cheesy sales pitch of yesterday, yes the best time to start this journey was 10 years ago but the next best time to start is today.